Census report compares top US counties with gay and lesbian households
Research has already indicated that metropolitan areas like San Francisco and New York City are home to significant numbers of same-sex couples, but what do the numbers show when those households are broken down between male-led same-sex households and female-led same-sex households? It depends on how you look at it, but no matter how you … Read More

Research has already indicated that metropolitan areas like San Francisco and New York City are home to significant numbers of same-sex couples, but what do the numbers show when those households are broken down between male-led same-sex households and female-led same-sex households?
It depends on how you look at it, but no matter how you slice it, but there are similarities and differences between male and female-led same-sex households, according to a new Census report evaluating data from 2020.
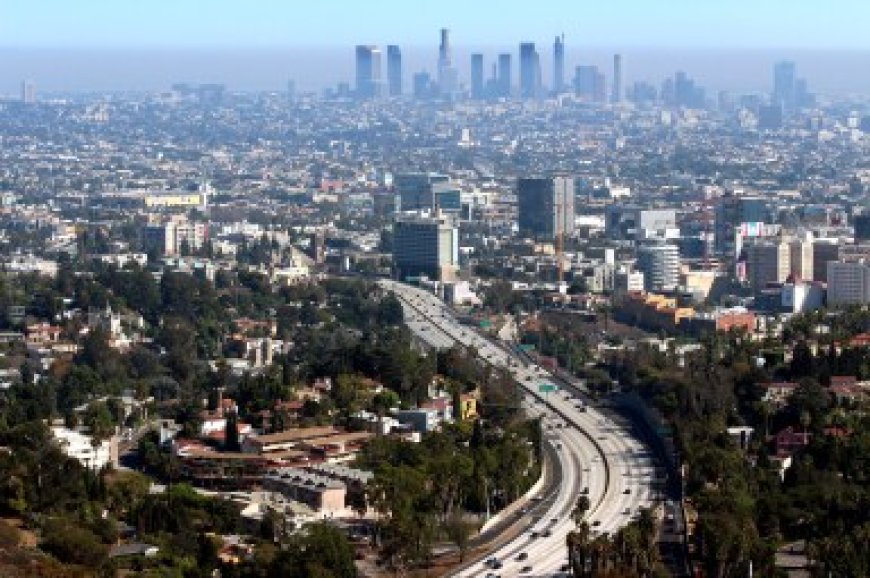
Looking at the counties with the largest number of households with same-sex couples, a key similarity is in Los Angeles County, which ranked number one in the country for female-female couples and male-male couples. Other areas on the top 10 lists for both male-male and female-female households included Maricopa, Arizona; Cook, Illinois; Harris, Texas; King, Washington; and San Diego, California.
But gender-based differences are clear when looking at other cities with significant numbers of female-led same-sex households. While Kings County (Brooklyn, New York) ranked seventh on the list of the most female-female households, it did not rank at all on the same list among male-male households. Instead, Manhattan ranked number two among counties with the most male-male households.
Other top 10 counties on the female-led household list included Alameda, California; Clark, Nevada; and Bexar, Texas. Others on the male-male household list included San Francisco, California; Broward, Florida; and Riverside, California.
Meanwhile, a separate but similar chart outlined the top 10 counties with the greatest share of same-sex households broken down by gender — and this measurement yielded more differences. For same-sex female households, Hampshire, Massachusetts led the way, followed by Multnomah, Oregon; Richmond, Virginia; Franklin, Massachusetts; Baltimore, Maryland, Tompkins (Ithaca), New York; St. Louis, Missouri; DeKalb, Georgia; the District of Columbia; and Buncombe, North Carolina.
The county with the greatest share of male-male couples was San Francisco, California, followed by the District of Columbia; New York, New York; Suffolk, Massachusetts; St. Louis, Missouri; Orleans Parish, Louisiana; Denver, Colorado; Fulton, Georgia; Richmond, Virginia; and Broward, Florida.
“This is the first time that we’ve looked at male-male and female-female same-sex couple households separately at the county level,” Lewis Liu, a Census spokesperson, told Gay City News in a written statement. “While we have collected data on same-sex couples previously, the 2020 Census was the first Census where we had separate relationship response categories of “same-sex husband/wife/spouse” and “same-sex unmarried partner,” making this an ideal time to look at male and female same-sex couples at lower levels of geography.”
Male same-sex households represent a greater share of coupled households than female same-sex households, according to the Census. In San Francisco, which has the greatest share of same-sex male households, male-male households represent about 6% of the population, while female same-sex households make up 4% of Hampshire, Massachusetts, which boasts the greatest share of female-led same-sex households in America.
In another example, 5.7% of Washington, DC consists of male-male same-sex households compared to 2.3% for female-female same-sex households.
The report, released Aug. 21, comes three years after the Census released a report showing a broader overview of the concentration of same-sex households in the United States. That report showed that same-sex couples represented 2.8% of all coupled households in San Francisco, followed by Portland, Oregon, at 2.6%. Other cities on the top 10 list were Seattle, Washington; Orlando, Florida; Austin, Texas; Miami/Fort Lauderdale, Florida; Boston, Massachusetts; Denver, Colorado; Phoenix, Arizona; and Baltimore, Maryland.
Notably, neither the latest report nor the 2021 report offered data on the gender identity — or the sexual orientation — of the people in those households. It is not clear which percentage of couples included trans or non-binary individuals or people who are bisexual, pansexual, or other sexual orientations.

 Mark
Mark 


